Skip to the content Back to Top

As the air gets crisper and precipitation drives us indoors, Fall is a great time to reflect and to find energy for new projects and adventures.

Have you thought about the web presence your museum, archive or library collection has? Are you providing users with modern tools to help them research your records and share them with others. Here are 10 ideas to read on a blustery Fall day, and that could add some sparkle to your website and online collections.

  1. Upgrade to a more modern search engine, such as our Andornot Discovery Interface, with features users expect when searching. For example, see how we helped Forestry Innovation Investment with their ThinkWood Research Library.
  2. Add ever more historic content to attract users interested in local history and genealogy, like the Arnprior & McNab/Braeside Archives did with back issues of the Arnprior Chronicle newspaper.
  3. Add a map interface so users can browse geographically, like the one we built for the Ontario Jewish Archives.
  4. Have lots of documents? Why not index the full text of them, then when a user searches for keywords, take them directly to the most relevant page in the PDF. No more downloading and repeating the search within the PDF to find the right page. Learn more.
  5. Get out in front of Community Engagement by adding the Disqus commenting system to your search results, so users can more easily discuss items in your collection, help identify people and places, and provide feedback to you.
  6. Make sure your website or search engine is mobile friendly. Google and other search engines now place mobile-friendly results higher in their rankings. And make sure you have a sitemap and permalinks so your collection can be easily indexed by Google and Bing.
  7. Planning to digitize large works, such as maps, paintings, or architectural drawings? Will users be able to see the fine detail in the resulting images on your website or in your search engine? Our Image Zoomer can help, by allowing users to easily zoom in on specific areas of a large image, without having to download that very large file.
  8. Is your website looking dated? Maybe it has the digital equivalent of large shoulder pads or flared pants? Time for a refresh? Let us help with a Content Management System and new graphic design, like we did recently for PRCVI (the BC Provincial Resource Centre for the Visually Impaired).
  9. Can't attract the attention of your own IT staff to help with your website or software? Why not have Andornot host it?
  10. On a tight budget? Consider our low-cost Digital History Hub platform for putting collections online and making virtual exhibits.

Contact us to discuss any of these ideas, and ones of your own.

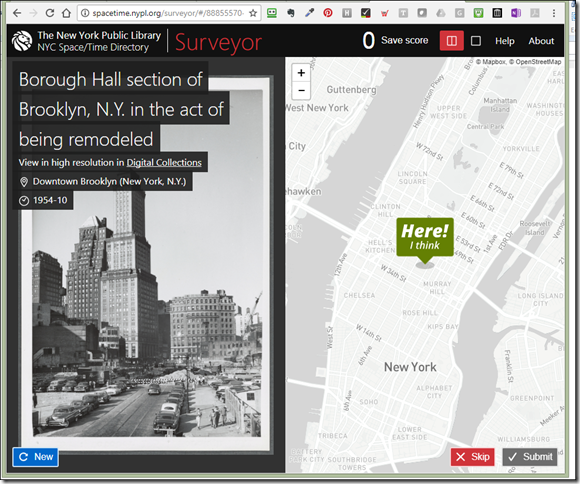
Determining the exact location of historical photos is always a challenge, but Surveyor, a new open source tool just released by the New York Public Library (NYPL) offers a neat crowdsourcing option.  It was developed to help address the problem of photos with very general titles, or only a street name or neighbourhood, some of which may no longer exist.

The NYPL has uploaded a set of photos and users can click through and move the map until the marker is in the correct location. There is an optional step of noting the direction and angle of the view of the image.

image

This project is part of the New York City Space/Time Directory to create open source tools to help other cities, libraries and individuals to map and explore history.

Let us know if you’d be interested in adding a crowdsourcing project like this to your site. Crowdsourcing is a great way to encourage community involvement as well as enhancing the information about items in your collection. Contact Andornot to discuss possibilities!

Maps are a wonderful way to explore a collection that has a geographic aspect. Zooming, panning and clicking pins are a fun and interactive means for users to discover resources, as well as to see the spatial relationship between them. 

Some example uses for a map interface are to plot items such as:

  • Photographs taken around the world.
  • Landmarks and historic places or streets.
  • Public art on city streets.
  • Artifacts found or manufactured in various locations.

Over the years, Andornot has added geographic features to many projects, ranging from very simple links to Google maps showing a single point, to dynamic applications that plot multiple records on a single map, scaling the map up and down as new resources are added to the underlying database.

Andornot's map interfaces can be added to our Andornot Discovery Interface as well as used with Inmagic WebPublisher PRO and our Andornot Starter Kit.

The examples below are intended to give you ideas for adding a map interface to your collection, ranging from full featured dynamic interfaces down to very simple links to Google Street Views.

Dynamic Map Interface

The Ontario Jewish Archives' Jewish Landmarks of Ontario is an excellent example of a dynamic map interface. Pins are drawn on an open source map based on the latitude and longitude in records in the underlying database.

The map automatically zooms out to encompass all the available pins, but users can easily zoom in to an area of particular interest, with the pins rearranging to show as many as can fit on the screen.

Any pin can be clicked to bring up more details about the location.

Using filters at the top of the interface, the range of pins shown can be limited by time period and category.

This particular map interface has the Andornot Discovery Interface behind it, for full-featured textual searching as well as geographic browsing.

Static Image Map

Not every organization has the budget for the dynamic map interface above, but can still add a geographic search option using static image maps. In web development, an image map is any image with coordinates applied to it. 

For example, in these maps of the City of Richmond, coordinates allow users to click on current and historic planning areas, as well as legal lot descriptions, to view associated records, which are themselves maps (yes, a map to search for a map!).

The Heritage Burnaby Charting Change Atlas is another example of static maps with overlaid data.

These static maps are relatively quick and simply to create, but do have the disadvantage of not scaling up or down in size for mobile devices. And of course, they don't show results on map, only the overall geographic area, so they don't give users a sense of how records are arranged geographically. But still, with minimal effort, they add a new starting point to any search.

Simple Map or Street View Link

Our last example shows a link in a single search result, for a building, to its location in a Google map. This doesn't help a user to search geographically, but can at least direct them to a physical place once they find something of interest. This could be combined with either of the above map interface ideas to provide more than one geographic feature.

GIS Systems, HistoryPin and More

If your organization has an existing GIS system, especially one made publicly available as is the case in many municipalities, you might be able to layer your cultural collections into that system. People can use all the features of the existing GIS system to search and browse your region, with the choice to enable a cultural layer showing information about artifacts, photos, buildings, etc. in your historic collections.

Another option to explore is to add content to web services that already have a mapping component, such as HistoryPin.

Most of the above ideas are based on your records having latitude and longitude information in them. It's not too hard to add this, based on place names. Andornot can help to "geocode" your data so it's ready for any of these map interface ideas.

As you can see with the above examples, there's a mapping option available for every budget and need, and for different types of collections.

Contact us to discuss giving a fun, interactive new face to any of your collections.

Categories

Let Us Help You!

We're Librarians - We Love to Help People